I saw some exciting things happening in our blended learning cohort classrooms this week! As teachers become more comfortable with the models they are employing, they are iterating and refining to provide greater differentiation and opportunities for students to have agency in their learning process. Here are some examples of how teachers are pushing themselves and their students to grow and improve.
Christy Thomason, 1st Grade at Negley Elementary School
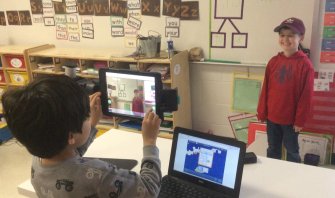
Christy has set up a math wall station where students can practice and apply previously learned concepts independently. A cool addition is a recording studio set up where kids can demonstrate learning in a video and post directly to their SeeSaw account for the teacher to view. Christy can use this as a formative assessment and accountability piece for students independent work.
Allison Auth, 1st Grade at Elm Grove Elementary School

Ally has grouped students for learning stations and assigned a station leader who can provide peer tutoring assistance. The peer tutor I observed sat between two other students and provided feedback on adding coin values. This reinforces her understanding of coin values while helping her peers practice and correct mistakes. Students worked collaboratively and respectfully and were fully engaged in the learning! In this .gif, she notices her partner has accidentally put a nickel instead of a dime. She points this out to him, he swaps out the coin and they recount together.
Wendi Cruce, 1st Grade at Elm Grove Elementary School
Wendi borrowed 3D printing pens from the maker space to reinforce geometry concepts. Students review academic vocabulary such as rhombus, hexagon, vertex, edge and others while tracing shapes with a 3D pen. Students then pull the plastic shape from the paper and store in a plastic bag. Next week they will use them to construct 3D shapes. This was a small group, teacher-led station. Other students worked on individual learning paths in Dreambox during station rotation.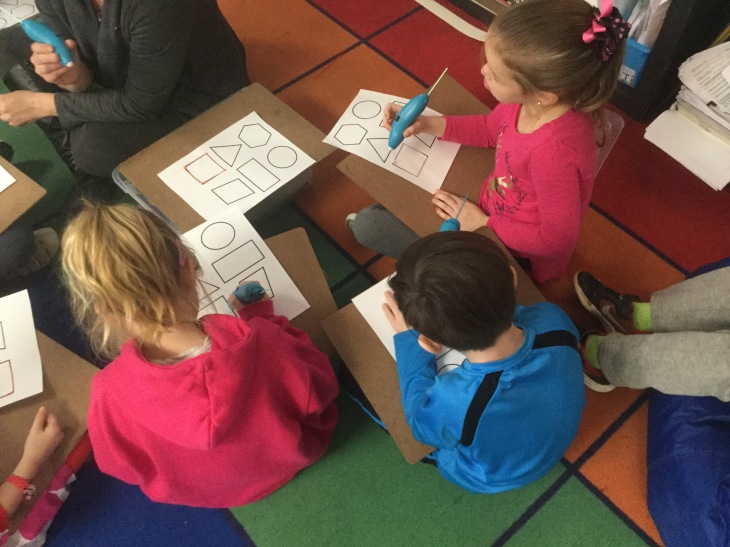
Bertha Endsley, 3rd Grade at Kyle Elementary School
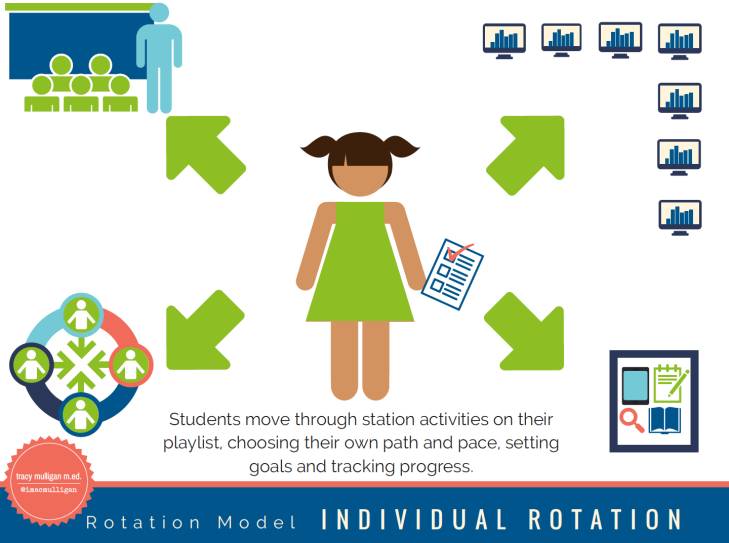
Bertha has been combining an individual rotation model with a playlist and Google classroom for her Focused Instructional Time (FIT). Students work independently on both online and offline activities in the playlist while she pulls small groups for focused intervention. Now that students have learned the process, she is going to move to using different playlists based on learning needs. Additionally, she will incorporate a progress tracking chart and self-checking rubrics to build greater independence in students and to promote higher levels of work quality.
Caitlin Boyce-Brejcha, 1st Grade at Tobias Elementary School
Caitlin has been blending her math instruction since last spring using a station rotation.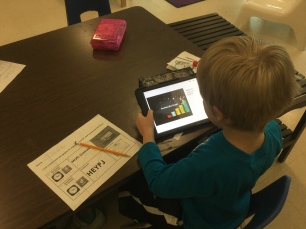 She has recently moved to an individual rotation with paper playlists for station time. Students are expected to complete everything on their playlist for the week but may do it in any order. By doing this, she is meeting her goal to increase student agency and build independent learning skills. To track their time goals on Dreambox Math, Caitlin has taught students to use the iPad timer. Students mark off completed work for the week and post some of their assignments to SeeSaw for her to check later. She is able to pull small instructional groups for greater differentiation during station time. Caitlin employs this model several days each week.
Emily Hawk, 4th Grade at Tobias Elementary School
As we move into testing season, the use of data to determine specific learning needs of students is more important than ever. Using her data dashboard in Dreambox, Emily has found that some students are struggling with grade level math concepts. Once she has identified students struggling with their assign focus lessons, Emily plans to assign prerequisite concepts from 2nd and 3rd grade Dreambox lessons in order to scaffold their learning. Once they have demonstrated mastery of those earlier skills, she will then move them on to the grade level skills and monitor their success. This will be incorporated with face to face small group instruction and offline application of concepts.
Melissa Ivicic, 4th Grade at Tobias Elementary School
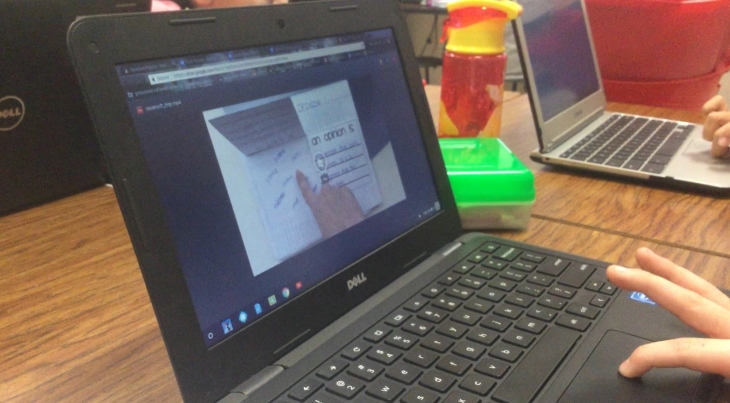 Melissa has recently started creating her own video lessons for students to access through their playlists on Google Classroom. This allows her to teach and model activities and concepts while giving students control over their path and pace of learning. Additionally this has given her more flexibility to pull small groups for targeted instruction. Quotes from her kids:
“I can go at my own pace. I can pause it right there and then I can write down what I need to. And then I can start the video again when I’m ready.”
“Some teachers talk really fast and you might not understand what they said so with the video you can follow along and watch it again if you need to.”
“It’s just more rememberable if you put in on the computer. We have something to refer to back. We can go back to our drive and get it and use it.”
Since implementing video lessons, several other teachers have started trying this as well. She is inspiring others to use technology in new ways to meet the needs of individual learners!
Heather Myers, 3rd Grade at Carpenter Hill Elementary School
From Heather:
“Today I tried station rotation model a little differently. I allowed them to rotate throughout the three stations at their own pace, allowing for some to take a little longer if needed and some to get through faster. I took a video and asked them to give me some reflections. Most of them liked it better, commenting that they could go at their own pace.”
Heather is exploring the individual rotation model to determine what benefits it may have for her and her students. The advantage she is interested in is the ability to have greater flexibility and choice when it comes to the pace of learning. With this model she can still pull small groups for instruction but is not ruled by the clock and specific station intervals. Students have greater agency with an individual rotation model. I’m exited to work with her as she implements this in her classroom!


